SCHEV
|
Web Policy
|
Contact SCHEV
SCHEV Home
>
Higher Ed Data
>
Regional Population Projections
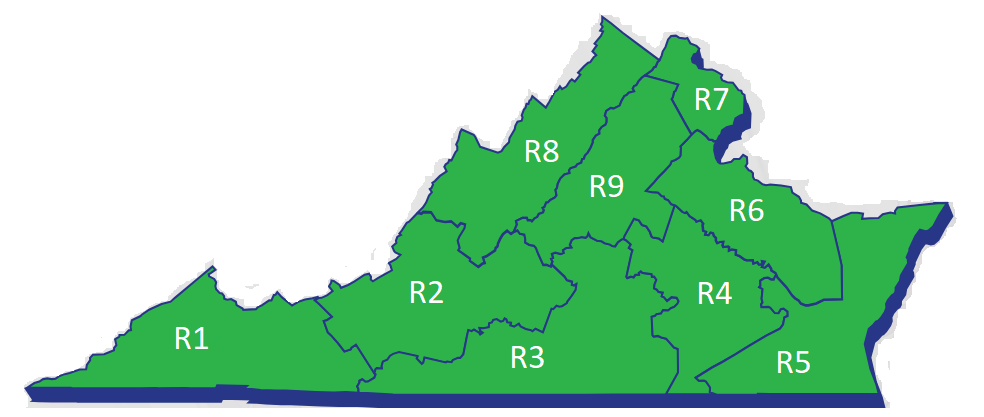
Total population by region, as
projected by the Weldon-Cooper Center
. Regions are defined using the
Go Virginia
regions. Clicking on a region name updates the table below with localities in that region.
Projections of Population Estimates
Region
Population Est. 2020
Population Est. 2030
% Change from 2020
Population Est. 2040
% Change from 2020
Population Est. 2050
% Change from 2020
R1) Southwest Virginia
370,977
335,332
-10%
316,426
-15%
302,255
-19%
R2) Roanoke/New River/Lynchburg
779,658
786,095
1%
810,991
4%
848,026
9%
R3) Southside
366,042
343,061
-6%
327,103
-11%
316,041
-14%
R4) Greater Richmond
1,300,469
1,404,356
8%
1,515,375
17%
1,649,074
27%
R5) Hampton Roads
1,749,192
1,804,199
3%
1,858,681
6%
1,940,982
11%
R6) Greater Fredericksburg
525,595
573,817
9%
639,995
22%
715,752
36%
R7) Northern Virginia
2,550,377
2,828,990
11%
3,149,442
23%
3,517,032
38%
R8) Shenandoah Valley
547,000
576,681
5%
618,882
13%
670,347
23%
R9) Greater Charlottesville
442,083
476,471
8%
522,476
18%
576,301
30%
Virginia (total)
Region
Population Est. 2020
Population Est. 2030
% Change from 2020
Population Est. 2040
% Change from 2020
Population Est. 2050
% Change from 2020
Virginia
8,644,727
9,129,002
6%
9,759,371
13%
10,535,810
22%
Clicking on a locality name opens a new window to USAFACTS.org and the population history for that locality.
Notes:
Full Legal Name -
"Virginia Polytechnic Institute and State University" (Virginia Tech); "The College of William and Mary" (William & Mary)
SCHEV Policy Analytics